The demographic future for the U.S. and the world looks very different than the recent past in key respects. Growth from 1950 to 2010 was rapid—the global population nearly tripled, and the U.S. population doubled. However, population growth from 2010 to 2050 is projected to be significantly slower and is expected to tilt strongly to the oldest age groups, both globally and in the U.S.
Aging is not exactly news—the U.S. and global populations also turned older from 1950 to 2010. But future prospects for aging have garnered more attention because, unlike in the past, younger populations, those of children and those of middle-age adults, are at near standstill. Thus, the social and economic effects of aging are likely to be felt more acutely in the future.
Population Change
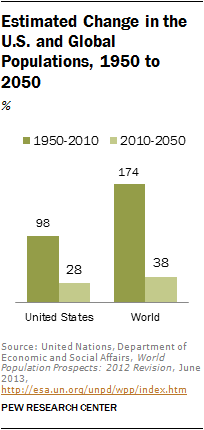 The U.S. population is projected to increase from 312.2 million in 2010 to 400.9 million in 2050.33 For this four-decade period, that is an increase of 28% at an average annual rate of 0.6%. The anticipated annual rate of growth in the U.S. population is significantly slower than in the past. In the six decades from 1950 to 2010, the U.S. population had increased from 157.8 million to 312.2 million, a total gain of 98% at an average annual rate of 1.1%. Thus, the projected annual rate of growth in the U.S. population is only about half the rate of growth experienced in the recent past.
The projected slowdown in population growth is even sharper in the world overall. From 1950 to 2010, the world population increased from 2.5 billion to 6.9 billion, or by 174%. The average annual rate of growth—1.7%—was much higher than in the U.S. In the future, the global population is expected to increase from 6.9 billion in 2010 to 9.6 billion in 2050, or by 38%. The average annual rate of growth—0.8%—is only slightly higher than the rate projected for the U.S.

Birth Rates, Death Rates, and Life Expectancy
 The growth of a population and changes in its age structure are closely related to trends in birth and death rates and changes in life expectancy. Both in the U.S. and in the world, birth rates have trended down since 1950, and the gap with respect to death rates has narrowed sharply, leading to a slowdown in population growth. At the same time, life expectancy has improved significantly and has contributed to the aging of populations. Both trends—falling birth rates and rising life expectancy—have been more pronounced globally than in the U.S.
From 1950 to 1955, the crude birth rate in the U.S. averaged 24.4 per 1,000 people. That was more than double the crude death rate of 9.6 per 1,000 people.34 Thus, population growth was more robust in the past. By 2010-2015, the crude birth rate in the U.S. had fallen to 13.2, much closer to the crude death rate of 8.3. By mid-century, from 2050 to 2055, the birth rate is projected to drop further to 12.2 and the death rate to rise to 10.2. Consequently, population growth from 2010 to 2050 should be much slower than it was from 1950 to 2010.
 A similar convergence in birth rates and death rates is underway globally. The birth rate worldwide from 1950 to 1955—37.0 per 1,000 people—was almost twice as high as the death rate of 19.1 per 1,000 people. This led to robust gains in population. However, it is expected that from 2050 to 2055, the global birth rate—14.4—will be nearer the projected global death rate of 9.9. Thus, as in the U.S., the global population should increase more slowly in the future.
The decrease in birth rates around the world is linked to a number of factors. These include social trends, such as the decline in marriage rates and the movement away from the family as a core living arrangement, and economic forces, such as the rising cost of raising children, the growing number of women in college and in the labor force, urbanization and, with the emergence of social insurance, the reduced need for children as a support mechanism in old age. Development of the contraceptive pill and its widespread adoption starting in the 1960s is also a factor. Government policies, such as China’s imposition of a one-child policy in 1979, also may have played a role.35
 Large gains in life expectancy accompanied the decline in birth rates in the U.S. and around the world. The average U.S. resident could expect to live for 79 years during 2010 to 2015, up from 69 years during 1950 to 1955. The improvement is even more striking for the world, with longevity rising from 47 years during 1950-1955 to 70 years during 2010-2015. These gains provided the foundation for an increasingly older population. Future gains in life expectancy are not expected to be nearly as sharp, either in the U.S. or the world, but it is anticipated that the aging phenomenon will persist because of steep drop-offs in birth rates.
The gains in longevity were initially due to reductions in infant mortality. Those, in turn, were driven by better sanitation, improvements in public health, and advances in overcoming childhood diseases, such as smallpox, polio and measles. General improvements in living standards and nutrition and changes in health-related behaviors have also been factors. In more recent decades, gains in life expectancy are increasingly being realized at older ages. That is the consequence of medical advances against heart disease, cancer and other adult afflictions. This phenomenon has been dubbed the “longevity transition.”36
Population Change by Age Group
 The aging of populations is not a new phenomenon—the U.S. and global populations have both turned older since 1950. However, future prospects for aging have garnered more attention because population growth is likely to be concentrated in the older age groups. The number of children and the number of middle-age adults are expected to increase only slightly, and the social and economic effects of aging may be felt more acutely in the future.
Even in the past, the rate of growth in the population of seniors (ages 65 and older) exceeded the rate of growth in the populations of younger cohorts. In the U.S., the population of seniors more than tripled, from 13 million in 1950 to 40.8 million in 2010, a total gain of 213%. The percentage increase was greater than the increase in the population of 15- to 64-year- olds (105%) and the increase in the population of children younger than 15 (45%).
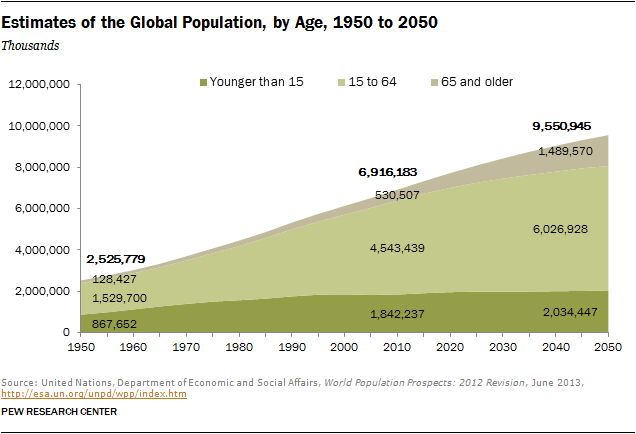
A similar trend characterized changes in the global population by age groups. The global population of those 65 years and older more than quadrupled, from 128.4 million in 1950 to 530.5 million in 2010. That was a gain of 313%, significantly greater than the increase of 197% among 15- to 64-year-olds and 112% among children younger than 15.
 The population of seniors in the U.S. and in the world should continue to increase at a fast pace from 2010 to 2050. In the U.S., the population ages 65 and older is projected to increase by 111% (to 86 million in 2050), and globally it may increase by 181% (to 1.5 billion in 2050).
 Notably, the annual rate of growth in the population of seniors in the future is expected to be much as it has been in the past. In the U.S., the projected rate of increase from 2010 to 2050 is 1.9% annually, about the same as the rate that prevailed from 1950 to 2010. A temporary surge in the growth rate of this population will occur from 2010 to 2030 as the baby boomers turn 65 and older. However, the rate of growth in the population of seniors is expected to slow sharply from 2030 to 2050.37 Globally, the population of seniors is projected to grow at 2.6% per year from 2010 to 2050. That is only slightly higher than the annual rate of growth of 2.4% from 1950 to 2010.
The key distinction between the past and the future is that the growth in the population of young children virtually grinds to a halt through the middle of the century. Estimates indicate that the global population of children younger than 15 will increase by only 10% from 2010 to 2050. The U.S. will likely experience more growth—17% in total from 2010 to 2050—but at the modest rate of 0.4% annually.
The future may also feature steep drop-offs in the rates of growth of 15- to 64-year-olds. From 1950 to 2010, this age cohort grew at an annual rate of 1.2% in the U.S. and at an annual rate of 1.8% in the world overall. The annual rates of growth are projected to be only one-third as high from 2010 to 2050—0.4% in the U.S. and 0.7% globally.
 Because of the lack of change in the size of younger age cohorts, seniors are expected to account for much higher proportions of overall population growth in the future than they did in the past. In the U.S., the senior population is projected to increase by 45.2 million and account for 51% of the overall increase of 88.6 million people. In sharp contrast, the change in the populations ages 65 and older accounted for only 18% of the increase in the overall population from 1950 to 2010.
Similar to the projections for the U.S., the global increase in the population ages 65 and older is expected to account for 36% of the overall increase of 2.6 billion from 2010 to 2050. This, too, stands in sharp relief with the past, when this age cohort accounted for only 9% of the increase in the global population from 1950 to 2010.
Changes in the Age Structures of the U.S. and Global Populations
 The aging of the U.S. and global populations is encapsulated in the steady rise in their median ages since 1950. In the U.S., the median age increased from 30 in 1950 to 37 in 2010. Globally, the median age rose from 24 in 1950 to 29 in 2010. In the past, therefore, the U.S. aged faster than the world overall.
In the future, however, the world is projected to age more rapidly than the U.S. The median age in the U.S. should rise moderately, from 37 in 2010 to 41 in 2050. The increase in the global median age likely will be sharper, from 29 in 2010 to 36 in 2050.
As the world population turns older at a faster clip, the U.S. share in the global population of seniors should diminish. In 1950, the U.S. was home to 10.2% of the world’s seniors. That share had slipped to 7.7% by 2010 and is projected to drop further to 5.8% by 2050.

In a reversal of past trends, the share of children younger than 15 who live in the U.S. may nudge up, from 3.4% to 3.6%.
 It is projected that the U.S. will attain a significant milestone in aging by 2050. By then, the U.S. population ages 65 and older will be larger than the population of children younger than 15. More specifically, one-in-five U.S. residents (21.4%) is expected to be 65 and older in 2050 compared with less than one-in-five residents (18.2%) who are younger than 15. In 2010, the youngest age cohort accounted for 19.8% of the U.S. population, significantly higher than the share of the oldest age cohort (13.1%).
 The age structure of the global population is headed in the same direction as the U.S. The share of children younger than 15 in the global population is expected to drop from 26.6% in 2010 to 21.3% in 2050. The share of people 65 and older is expected to double, from 7.7% in 2010 15.6% in 2050. Overall, the age structures of the U.S. and the world population will resemble each other more closely in the future.
Dependency Ratios in the U.S. and Globally
 The old-age dependency ratio in the U.S. is projected to nearly double. The number of people ages 65 and older per 100 working-age people in the U.S. is expected to increase from 19 in 2010 to 36 in 2050.
That is partly due to the aging of baby boomers and partly due to the drop-off in population growth. However, because the child and middle-age populations in the U.S. are expected to increase at about the same pace, the child dependency ratio in the U.S. will be unchanged at 30 from 2010 to 2050. Thus, the future increase in the total dependency ratio in the U.S.—from 49 dependents per 100 working-age people in 2010 to 66 in 2050—is driven by aging.
The increase in the old-age dependency ratio in the U.S. is not a new phenomenon. The ratio previously rose from 13 in 1950 to 19 in 2010. However, the child dependency ratio fell sharply in the past, from 42 in 1950 to 30 in 2010. That was the consequence of tumbling birth rates in the wake of a baby boom-fueled bulge in the middle of the U.S. age distribution. Thus, despite an overall aging of the population, the number of dependents per 100 working-age people in the U.S. fell from 54 in 1950 to 49 in 2010.
 Old-age dependency ratios in the world overall are less than in the U.S. but they are projected to rise slightly faster. The number of people ages 65 and older per 100 working-age people in the world is expected to more than double in the future, from 12 in 2010 to 25 in 2050. However, global increases in old-age dependency may be balanced by steep declines in the child dependency ratio, from 41 in 2010 to a near U.S.-like level of 34 in 2050. This means that the total dependency ratio in the world is expected to increase from 52 in 2010 to 58 in 2050, a much smaller increase than in the U.S.


