Updated August 13, 2015: This new edition includes corrected estimates for Iceland, Luxembourg, the Netherlands and Taiwan, and some related aggregated data.
This study estimates the population distributions by per capita income in 2001 and 2011 in 111 countries. The distributions are derived from household survey data collected in each country. For most countries, however, survey data from exactly those two years are not available. Thus, the distributions for 2001 and 2011 are typically estimated by projecting changes in income or consumption from the dates of the surveys to either 2001 or 2011.
This appendix explains the methods used to project income or consumption to 2001 and 2011, describes the household survey data and how they are used to estimate the population distributions by income, specifies the other data that are used, and notes some limitations of the process. An accompanying set of tables presents the population distributions by income in all countries, the major characteristics of countries, such as median income, population and region, and country-specific details on data sources and survey dates.
The countries included in the study had a combined population of 6.2 billion in 2011, or 88% of the global population. They also represented 85% of global output in 2011. The countries range across the spectrum of economic development, from developing, such as Bangladesh and Uganda, to emerging, such as Argentina and Turkey, and to advanced, such as the U.S. and Germany. Countries that could not be included due to the lack of data are also varied, ranging from the high income, such as Austria, Japan, Saudi Arabia, South Korea and Sweden, to the low income, such as Chad, Haiti and Sudan.
Given the diversity of the countries that are analyzed and the population they represent, the estimate of the percentage distribution of the global population by income is unlikely to change if more countries were to be added. But the number of people who are poor, middle income or of some other income level are somewhat undercounted. The extent of the undercount varies by region. The selected countries account for almost 100% of the population of North America and South America in 2011, and 93% of Europe, 88% of Asia & South Pacific, 78% of Africa, and 62% of Central America & the Caribbean.
Projections of Survey Data to 2001 and 2011
The projection of household survey data to 2001 and 2011 requires three steps:
- Extrapolate reported income or consumption to 2001 or 2011
- Express estimates of income or consumption for 2001 and 2011 in 2011 prices
- Convert income or consumption from local currency units to 2011 purchasing power parities (PPPs)
Extrapolation of Income or Consumption
If the data source is a household survey conducted in a year other than 2001 or 2011, income or consumption from the survey is extrapolated to 2001 or 2011 assuming that it changes at an annual rate equal to 70% of the annual rate of change in real household final consumption expenditures from national income accounts, where household final consumption expenditures are expressed in local currency units and in per capita terms.52 The reason for using 70% of the rate of change rather than 100% is that national income accounts tend to overstate the level and change in consumption or income as measured by household surveys (Deaton, 2003). The extent of the overstatement will vary from country to country. This study follows the practice adopted by Dadush and Shaw (2011) and Birdsall, Lustig and Meyer (2013) of projecting survey data at 70% of the rate of change in national income account measures.
Although survey data on income or consumption are projected to 2001 and 2011, the underlying distributions are partly frozen at the date of the surveys. In China, for example, the estimates for 2001 are based on survey data from 1999. The distribution of people by consumption in China may change from 1999 to 2001 for two reasons. First, a general rise in consumption pushes everyone up the ladder. Second, some people may reach even higher rungs if they experience higher than average growth in consumption and others may slip down the ladder. The projection method used in this study captures the change due to the general rise in consumption but it does not capture the mobility of people up and down the ladder from 1999 to 2001. The same is true for the estimate of China’s distribution in 2011 which is projected from a 2010 survey.
In China’s case, this means that the reported change in the population distribution by income from 2001 to 2011 actually reflects somewhat more than a 10-year change because it still represents elements of the distributions from 1999 and 2010. In most other countries, the reported change in the distribution of the population by income is less than 10 years. For example, the survey dates for Russia are 2001 and 2009 and the estimated change in the distribution from 2001 to 2011 is reflective of changes over an eight- to 10-year period.
Conversion to 2011 Prices
It is necessary to convert income or consumption data to 2011 prices because the purchasing power parities for all countries are derived from the round of international price comparisons conducted in that year (additional detail on PPPs and their use in this study are provided in subsequent sections). The conversion is a matter of inflating the survey data by the change in a country’s consumer price index (CPI) from the relevant year to 2011.
Household survey data for 90 countries are derived from the World Bank’s PovcalNet database (see the section on data sources) which reports all data in 2005 prices regardless of the date of the survey. Therefore, the adjustment for these countries calls for inflating survey data by the change in the cost of living from 2005 to 2011. The household survey data for the remaining 21 countries is collected from the Luxembourg Income Study (LIS) and for these countries the inflation adjustment is carried from the relevant survey date to 2011.
Conversion to 2011 Purchasing Power Parities
The conversion of income or consumption from local currency units to 2011 purchasing power parities requires an intermediate step for most countries. In PovcalNet, all survey data are expressed in 2005 PPPs. Therefore, the data are first reverted to local currency units using the local currency to PPP conversion rates originally employed by the World Bank. Next, the PovcalNet data are converted from local currency units to 2011 PPPs.
In LIS, survey data are expressed in local currency units prevailing at the time. For several countries, the more recent survey data—for 2011 or years near to that—are expressed in euros but the data from years near 2001 are in currencies in existence before the adoption of the euro. These countries are Estonia, Finland, France, Germany, Greece, Ireland, Italy, Luxembourg, the Netherlands, Slovenia and Spain. It was necessary in these cases to convert data from the earlier years to euros because the 2011 PPPs for them are euro-denominated. The rates used for these countries to convert local currency units to the euro are the ones reported by Eurostat (see the section on data sources).
Data Sources and the Derivation of Population Distributions by Income
Household Survey Data
The principal data source for the study, covering 90 of the 111 countries analyzed, is the World Bank’s PovcalNet database. Estimates for the other 21 countries are derived from the Luxembourg Income Study database.
Both databases feature household survey data for individual countries from a number of years. A major difference is that the principal variable available for most countries in PovcalNet is consumption and the variable featured in LIS is income. Appendix Table A5 shows whether the data for a country pertains to consumption (72 countries in all) or to income (39 countries).53 Despite this mix, the more familiar term “population distribution by income” is used to reference all estimates. The extent to which consumption-based estimates may differ from income-based estimates is discussed in a subsequent section.
Derivation of Population Distributions by Income from PovcalNet Data
The specific PovcalNet data used in this study is a version created by the Center for Global Development. In the CGD version, the population of each country is divided into 10,000 equal-size groups, where each group represents 0.01% of a country’s population. The groups are ranked by per capita income or consumption. CGD researchers determined the income or consumption associated with each group by submitting repeated inquiries to the PovcalNet online tabulator.54
To take an example, CGD’s dataset includes data on the income distributions for Brazil in 2001 and 2009, the two survey dates closest to 2001 and 2011. From the 2009 survey, with figures reported in 2005 prices and PPPs, CGD tabulations show that 100% of Brazil’s population earned PPP $39,075.14 or less per month per capita, 99.99% of the population earned PPP $13,795.10 or less, 99.98% of the population earned PPP $11,355.56 or less, and so on for each 0.01% of the population.
Using the projection method described earlier, the 2009 data for Brazil are extrapolated to 2011. The result, now in 2011 prices and PPPs, is as follows: 100% of Brazil’s population earned PPP $53,993.34 or less per month per capita in 2011, 99.99% of the population earned PPP $19,061.83 or less, 99.98% of the population earned PPP $15,690.91 or less, and so on for each 0.01% of the population. These estimates of monthly per capita income are converted to daily values for the final stage of estimation.
The finely grained income distribution for Brazil, broken into 10,000 groups of people, is next collapsed into more aggregated sets of population distributions by income. One distribution breaks Brazil’s population into 200 income categories: PPP $1 or less, PPP $1 to $2, PPP $2 to $3, and so on. The highest category of income, empty of people in most countries, is PPP $199 or more. The other distribution divides the population into five income groups: poor (PPP $2 or less), low income (PPP $2.01 to $10), middle income (PPP $10.01 to $20), upper-middle income (PPP $20.01 to $50), and high income (PPP $50.01 or more).
Determining the share of Brazil’s population that earns a given range of income is a straightforward process. The share of the population that lives on PPP $1 per day or less is directly read from the CGD database (after all extrapolation has been done). Likewise, it is simple to read off the share of Brazil’s population that earns PPP $2 or less. The difference between the two yields the share of Brazil’s population earning between PPP $1 and $2 per day. The process is repeated to determine the share of the population earning PPP $2 to $3, etc.
The process described for Brazil is followed for all other countries for which PovcalNet data are sourced from CGD. The percentage distributions for all countries are eventually converted to head counts based on their populations in 2001 and 2011.55
The CGD’s version of PovcalNet data was released on April 28, 2014. The World Bank has updated some aspects of the database since that date. For example, while the CGD version features 2009 survey data for China, the World Bank recently added 2010 survey data for China. Thus, to feature the latest available data for some countries, the Pew Research Center itself deconstructed PovcalNet data for the following countries and years: China, 2010; Hungary, 2011; Kazakhstan, 2010, Laos, 2012; Latvia, 2011; and Mozambique, 2008.
Another recent update to the PovcalNet data is the addition of high-income countries. At the moment, PovcalNet provides data for upwards of 150 countries. This includes 41 of the 43 countries that are featured in LIS (the exceptions are South Korea and Taiwan). It is not necessarily the case, however, that both PovcalNet and LIS have data for the same years for every country. For example, the latest available data for Australia in PovcalNet is for 2003, but LIS features Australian data for 2010.
In April 2014, when CGD constructed its version of PovcalNet data, the overlap between PovcalNet and LIS was more limited. Generally speaking, PovcalNet leaned toward lower-income countries and LIS leaned toward higher-income countries. If data for a country for a desired year were available from either source, e.g., for Mexico and Russia, PovcalNet data were used in this study in the interest of maximizing the number of countries for which data come from the same source.
Derivation of Population Distributions by Income from LIS Data
As noted above, the analysis in this study utilizes LIS data for 21 countries (all high income). The CGD version of PovcalNet had no data for 18 of these countries. For the other three countries—the Czech Republic, Estonia and Slovenia—more current data were available from LIS.
The population distributions by income for the LIS countries were estimated directly from the household survey microdata for each country. Survey respondents were assigned the per capita income of their household. These incomes were projected to 2011, expressed in 2011 prices, converted to 2011 PPPs and grouped into 200 categories using the method described above. Finally, frequency distributions of the populations by 200 income categories were computed from the microdata.
Estimates of Population Distributions from PovcalNet vs. Estimates from LIS
Does it matter if data for a country are extracted from PovcalNet or LIS? As an example, the table below shows estimates of the population distributions in Mexico and Russia in 2011 from the two databases. For Mexico, the underlying survey date is 2010 from both data sources. For Russia, the survey date is 2009 in PovcalNet and 2010 in LIS. The PovcalNet data for both countries refer to consumption and the LIS data are for income.
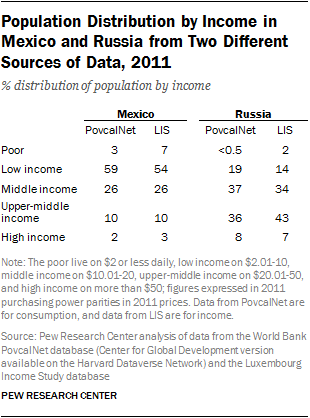
The estimated distributions in Mexico from PovcalNet and LIS are very similar. PovcalNet yields a lower estimate of poverty, consistent with the empirical regularity that consumption is often higher than income at the lower end of the income distribution. The share of the population that is middle income in Mexico is the same regardless of the data source.
In the case of Russia, LIS data lead to a higher estimate of the share of the population that is upper-middle income or high income—50% compared with the estimate of 44% from PovcalNet. This may partly be due to the fact that the estimates from LIS are based on a 2010 survey and the estimates from PovcalNet are derived from a 2009 survey. The share of Russia’s population that is middle income is similar across the two databases.
Purchasing Power Parities
Data on purchasing power parities—exchange rates corrected for differences in the prices of goods and services across countries—are needed to express incomes in all countries in a common currency and price level. Two sets of purchasing power parity data, one for 2005 and the other for 2011, are used in the analysis. The PPP data for both years are from the World Bank’s International Comparisons Program. The specific PPPs used in this report are the ones that pertain to individual consumption expenditures by households.
The consumption and income data in PovcalNet are expressed in PPPs derived from a round of international price comparisons conducted in 2005. The PovcalNet data are divided through by the 2005 PPPs to express them in local currency units. The PPP values are available on a country-by-country basis on PovcalNet. The complete set of 2005 PPP data is available on the World Bank’s website. The LIS data are expressed in local currency units and do not require this initial conversion.
The latest available PPPs come from a round of international prices comparisons conducted in 2011. The methods used in this round and the data are available at http://icp.worldbank.org/.
In the rare instance that a 2011 PPP was not available from the International Comparisons Program, e.g., for Argentina, an estimate from the Penn World Table 8.0 was used. For one country—Timor-Leste—a 2011 PPP was not available from either the International Comparisons Program or the Penn World Table 8.0. In this case, an “implied PPP conversion rate” from the International Monetary Fund’s World Economic Outlook database (IMF WEO) was used to estimate the change in Timor-Leste’s PPP from 2005 to 2011. The estimated change was then applied to the 2005 PPP used in PovcalNet for Timor-Leste to arrive at an estimate of the 2011 PPP.
Sources of Other Data
The other data needed for the estimation of population distributions by income in 2001 and 2011 are data on inflation (to express income or consumption in 2011 prices), household final consumption expenditures from national income accounts (to project survey income or consumption to 2001 or 2011), and population (for conversion to per capita terms and to determine head counts by income categories).
For most countries, these data were collected from the World Bank. In the event of missing information, the gaps were filled by data from the IMF’s WEO database (for inflation and national income data) or the United Nations (for population data). Taiwan presents a special case because the World Bank does not report data for the country. Thus, a combination of data from the IMF WEO database and the Taiwan National Statistics Office is used.
Mostly, the IMF WEO data are used to fill in missing information for a year or two. In Argentina, for example, the CPI through 2009 is reported in the PovcalNet database. This series is extended through 2011 using the CPI reported in IMF WEO. On occasion, alternative indicators are used. For example, in Nigeria, trends in GDP are substituted for changes in household final consumption expenditures data.
Survey data in the LIS database are expressed either in local currency units or in euros depending on the country and the year. For several countries, this means that more recent data, say, 2010 data for Germany, are expressed in euros but earlier data, 2000 in the case of Germany, are expressed in the local currency at the time (German mark). In these cases, factors for converting local currency to the euro were collected from Eurostat.
Survey Years and Choice of Countries
Of the more than 150 countries collectively covered by PovcalNet and LIS, the 111 countries included in the study were selected on the basis of the availability of data for 2001 and 2011, or for years close to 2001 and 2011. The choice of the latter year—2011—is driven by two considerations: first, it is the latest year for which benchmark estimates of purchasing power parties are available, and second, with a few exceptions, more recent household survey data are not available in PovcalNet or LIS. The starting point, 2001, is chosen so that the analysis may focus on changes in the distribution of the global population by income in the first decade of this century.
Appendix Table A5 shows a list of the 111 countries, whether the survey data for a country are from PovcalNet or LIS, and the dates of the surveys. For 96 countries, the first survey year ranges from 1999 to 2003. This means that projections to 2001 are typically done from a date no more than two years removed. At the other end, for 80 countries, survey data from 2009 to 2012 are available to estimate income distributions for 2011. Survey data for both 2001 and 2011 are available for only five countries: Belarus, Hungary, Poland, Romania and Senegal.
Overall, the gap between survey dates is at least 10 years in 35 countries, eight to nine years in 38 countries, five to seven years in 28 countries, less than five years in three countries (Guinea, Nicaragua and Uruguay), and is “indeterminate” in seven countries for which two projections are done for 2001.
The seven countries for which two projections are done for 2001 are Cambodia, Ghana, India, Kenya, Malawi, Malaysia and Niger. In these countries, the surveys from a date after 2001 were conducted in either 2004 or 2005. However, data were also available from surveys before 2001, with dates ranging from 1993 to 1998. It was decided that combining data from two surveys would yield better estimates of the population distributions by income in these countries in 2001.
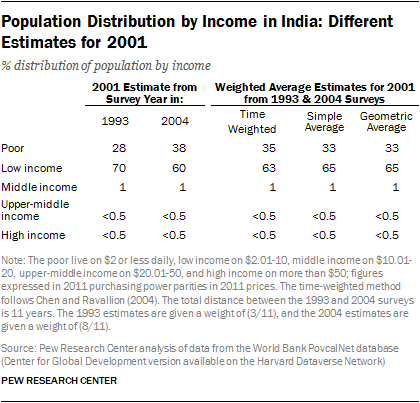
In India, for example, the distributions from a 2004 survey and from a 1993 survey are separately projected to 2001. Thus, two estimates are derived for the income of each 1/10,000th population group in India in 2001. The two estimates are then combined using the time-weighted method described in Chen and Ravallion (2004). The total distance between the 1993 and 2004 surveys is 11 years. The 1993 estimates are given a weight of (3/11), and the 2004 estimates are given a weight of (8/11). Alternative weighting methods, such as geometric means, yielded very similar results.
The accompanying table shows the two estimates of the population distributions by income for India from the 1993 and 2004 surveys. Surprisingly, the surveys show a regression in the economic well-being of India’s population from 1993 to 2004. The share of India’s population that is poor rises from 28% in 1993 to 38% in 2004, and the share that is low income decreases from 70% to 60%. The two surveys agree that scarcely any people in India lived on a middle-income budget or higher.
The two estimates for 2001 are combined using three different methods: a time-weighted average, a simple average, and a geometric average. The results are similar across the three methods. The time-weighted average is the estimate that is reported in this study. Since this method gives a higher weight to data from 2004 it results in a somewhat higher estimates of the share that is poor in India compared with the other two methods.
Consumption vs. Income
As noted above, the principal measure of economic well-being that is featured in PovcalNet is consumption (in 72 of 90 countries), and the variable featured in the 21 LIS countries is income. The estimates from the two sets of surveys are combined in the report in the interest of encompassing as many countries as possible. How might this affect the analysis?
Generally speaking, consumption often exceeds income for lower income families and falls short of income for higher income families. One reason for this is that families may smooth consumption over time, spending more than income in hard times and consuming less than income in good times. Other factors are also at play. For instance, lower income families are more likely to receive government assistance in the form of transfer payments or tax subsidies. Conversely, families with looser budget constraints are more likely to save and invest.56
In practical terms, the relationship between income and consumption suggests that a survey of household consumption is less likely to find people living on, say, $2 or less per day than a survey of household income. At the same time, a survey of consumption is also less likely to find people living on, say, more than $50 per day. The extent to which this happens will vary from country to country and possibly from year to year.
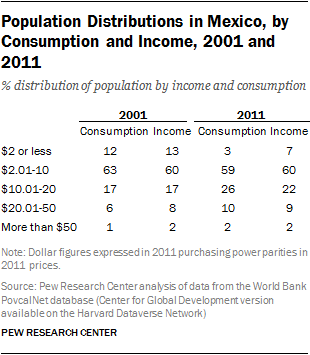
The accompanying tables show estimates of the population distributions by income and consumption in Mexico and Nicaragua, two among a small number of countries for which both types of data are available in PovcalNet. As expected, there are fewer people consuming $2 or less per day than earning that amount in the two countries in both 2001 and 2011. But there are more people with an income of $20 or more than with consumption of that amount, with the slight exception of Mexico in 2011.
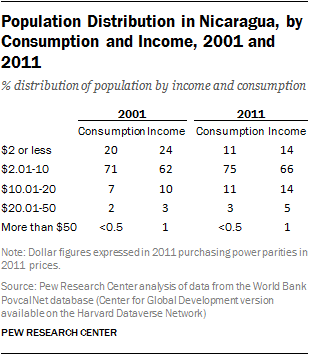
With respect to the “middle,” the findings differ across the two countries. In Mexico, the share of people consuming $10 to $20 daily is greater than or equal to the share with an income in that range. The opposite is true in Nicaragua. For example, 14% of Nicaraguans had an income of $10 to $20 daily in 2011, compared with the 11% whose consumption fell in that range. Overall, however, the differences in the distributions of Mexicans and Nicaraguans by consumption or income are more moderate than profound.
Other Data Considerations
Household Surveys vs. National Income Accounts
In this report, changes in the shares of the population that are poor, middle income or high income are estimated from household surveys. It is often the case that household income or consumption as reported in surveys falls short of what is estimated in national income accounts. Underreporting of income or consumption and lack of participation by better-off households are among the factors that are behind this phenomenon. Furthermore, the growth in household consumption or income is often higher as estimated from national income accounts than from household surveys (Deaton, 2003).
The gap between survey estimates and national income account estimates suggests that the size of the middle-income or higher populations may be underestimated in some countries. Likewise, the growth in these populations from 2001 to 2011 may be understated. Some researchers, such as Kharas (2010), scale the household survey data to reflect national income account estimates. But, as noted by Lakner and Milanovic (2013), it is not clear if the same scalar should apply across all points of the income distribution. National income accounts also often encompass items that do not bear a clear relationship to household well-being, such as consumption by nonprofit institutions serving households (Deaton, 2003). This study does not attempt to scale the survey data to conform to the national income accounts.
Adjusting for Household Size
In accordance with the general practice in this research area, this study determines the economic status of individuals by the per capita income or consumption of their household. This is the simplest possible mechanism for comparing the economic well-being of households of different sizes. It would perhaps be more realistic to allow for economies of scale in household consumption. A household of four, for example, does not need twice as much income as a household of two to experience the same standard of living (see Pew Research Center, 2012, for more on this issue).
However, the PovcalNet database reports only per capita household income and it is not possible to adjust for household economies of scale. To be consistent with the reporting of PovcalNet data, this study also converts LIS data to per capita incomes by dividing household income by the number of household members. The per capita income of a household is assigned to each member of the household.
This is not a significant issue for making comparisons from 2001 to 2011 because it is unlikely that household sizes have changed much within countries in the space of a decade. But when comparing across countries with households of different sizes, this results in a relative understatement of the well-being of countries with larger households. For example, the average household size in India is upwards of five, or double the average household size in the U.S. Thus, using per capita income to compare well-being in these two countries likely overstates the gap between them.
Urban vs. Rural Cost of Living
The 2005 round of benchmark international price comparisons led to concerns about the national representativeness of prices in China, India and Indonesia. In that round of international price comparisons, the price surveys in China were confined to 11 cities, and rural areas in India were underrepresented. Thus, in the past, many researchers followed the lead of Chen and Ravallion (2010) and derived urban and rural income distributions for India and China using estimates of an urban PPP and a rural PPP.
The 2011 round of international price comparisons were more comprehensive than the earlier rounds. Whether the national representativeness of prices in China or India remains an issue is unclear because of the lack of independent research on the issue. This report uses the PPPs for all countries as reported by the 2011 International Comparisons Program and does not attempt to impose an urban/rural distinction in any country.


